Figure 5.
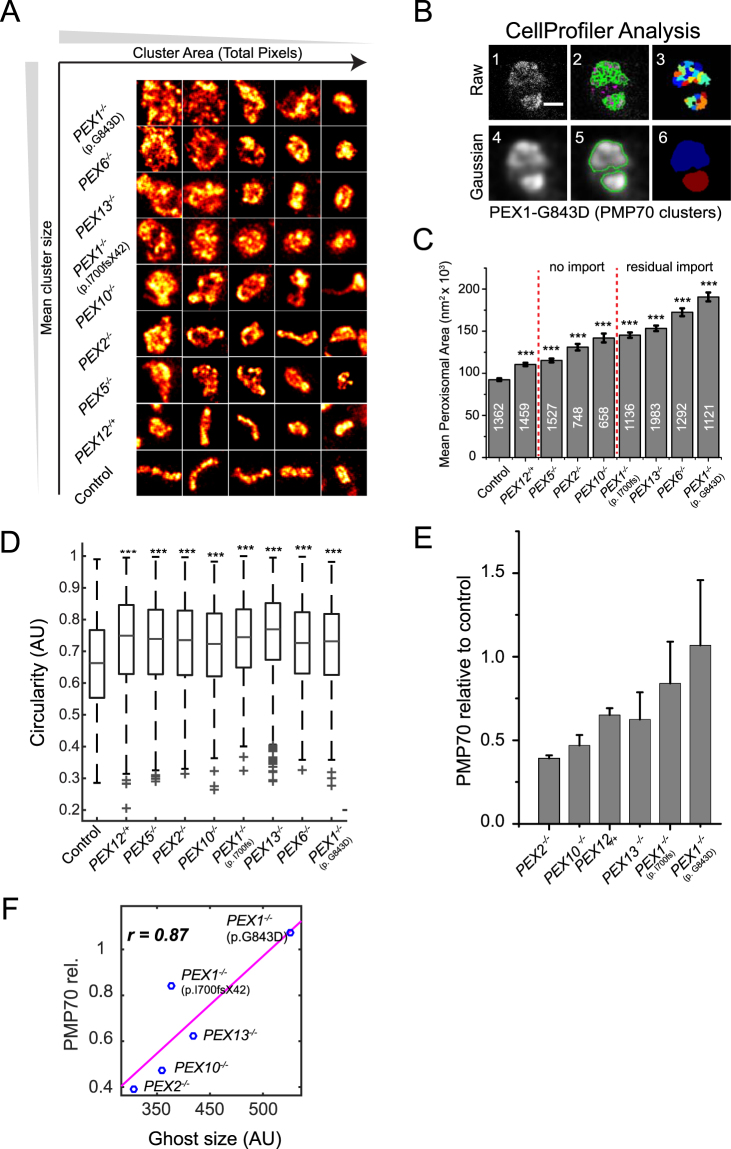
ZSS patient peroxisomal ghost analysis. (A) STED tiles (1000 × 1000 nm) of peroxisomal membranes form patient fibroblasts immunostained with anti-PMP70 and secondary antibody conjugated to Atto594. Tile images were smoothed with a 3 × 3 filter. (B) CellProfiler analysis workflow: (1) STED image of ghost peroxisomes, (2) segmentation of raw image, (3) object map of segmented antibody clusters, (4) Gaussian filter with 100 nm diameter applied, (5) segmentation results, (6) object map of segmented ghost peroxisomes. Scale bar 500 nm. (C) Gaussian analysis with 100 nm diameter. Bar graph indicates mean size of the peroxisomal structures. Ghost sizes were analyzed from three independent experiments, except PEX6−/− and PEX12−/+ (N = 2). The number of ghost peroxisomes measured per condition is indicated on bars, and statistics relative to control peroxisome was calculated using the Kolmogorov-Smirnov test. ***p < 0.0001. Error bars: SEM. (D) Circularity (F-Circularity) of peroxisomal structures. PBD is associated with an increase in peroxisome circularity. ***p < 0.0001. Error bars: SD. (E) Quantitative Western blot analysis of PMP70 abundance shows reduced PMP70 in PEX2−/− patient fibroblasts. N = 3 to 5. (F) Pearson correlation of PMP70 levels with ghost size of five homozygous ZSS patient fibroblasts cell lines showed positive correlation (p = 0.0541).

