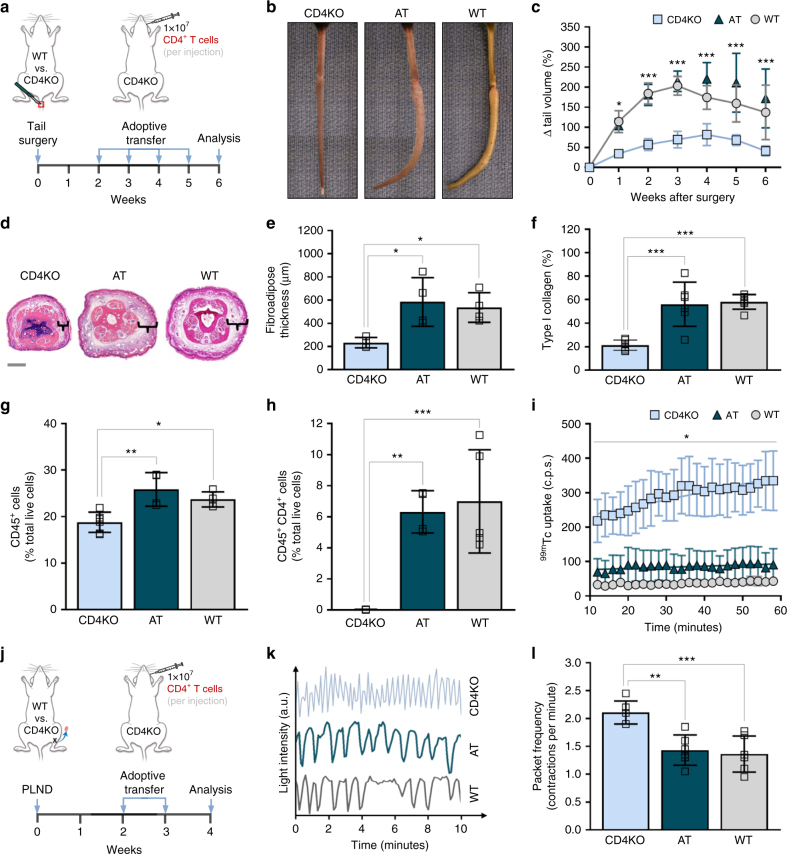
Fig. 1.
Adoptive transfer of CD4+ T cells to CD4KO mice after lymphatic injury results in lymphedema. a Schematic diagram of adoptive transfer following tail skin and lymphatic excision. Mice killed 6 weeks after surgery. b, c Representative photographs of tails (b) and quantification of tail volume change (c) (n = 4 for AT group; n = 6 for CD4KO and WT groups; two-way ANOVA with Sidak’s multiple comparisons test). d Representative H&E staining of tail cross-sections with brackets indicating fibroadipose tissue; scale bar, 1000 µm. e Quantification of fibroadipose thickness (n = 4 per group; 4 hpf per mouse). f Quantification of tail type I collagen deposition (n = 6 per group; 4 hpf per mouse). g, h FACS quantification of CD45+ cells (g) and CD45+CD4+ cells (h; n = 4 for AT and WT groups, n = 6 for CD4KO group; 4 hpf per mouse). i Quantification of decay-adjusted 99mTc uptake by sacral lymph nodes after distal tail injection (n = 4 per group; mean ± s.e.m.; two-way ANOVA with Sidak’s multiple comparisons test). j Schematic diagram of adoptive transfer following PLND. Mice harvested 4 weeks after surgery. k Representative graphs collecting lymphatic vessel pumping over time as determined by changes in ICG light intensity. l Quantification of collecting lymphatic vessel contractions per minute (n = 6 per group). Data representative of a minimum of two independent experiments with similar results; statistical analyses of one experiment shown. Mean ± s.d.; *P < 0.05, **P < 0.01, and ***P < 0.001 by one-way ANOVA with Tukey’s multiple comparisons test, unless otherwise specified. AT, CD4KO mice that underwent adoptive transfer with naive CD4+ T cells; a.u. arbitrary units; c.p.s, counts per second; FACS, fluorescence-activated cell sorting; H&E, hematoxylin and eosin; hpf, high-powered field; 99mTc, technetium-99m sulfur colloid; PLND, popliteal lymph node dissection; ICG, indocyanine green

