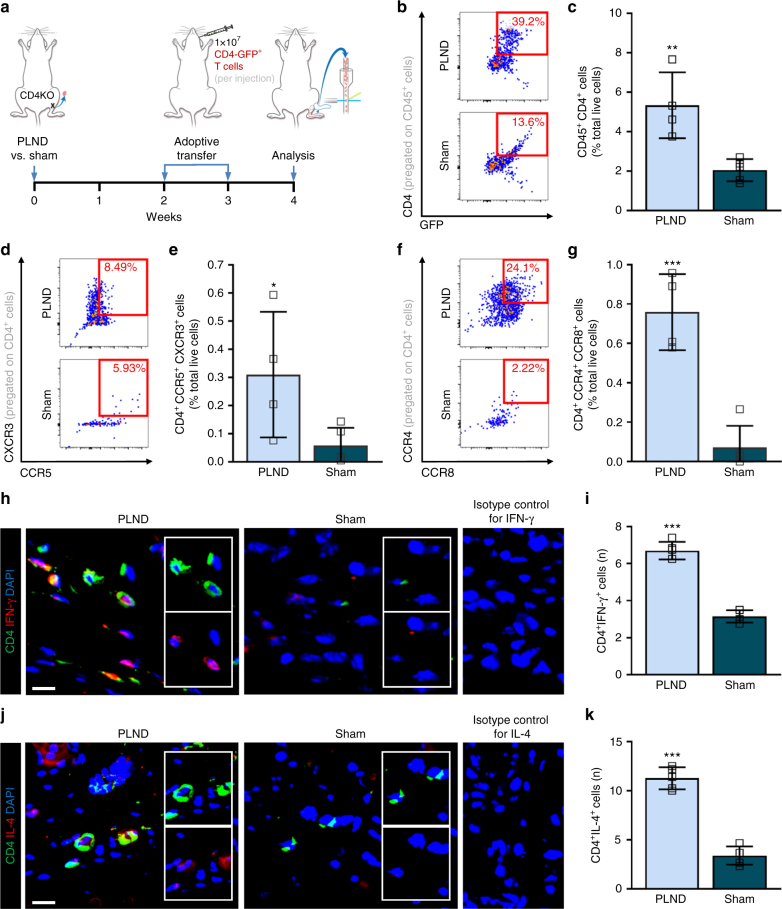
Fig. 2.
Adoptively transferred CD4+ T cells differentiate into a mixed Th1/Th2 phenotype. a Schematic diagram of adoptive transfer following PLND versus sham surgery. Mice killed 4 weeks after surgery. b, c Representative FACS plots (b) and quantification (c) of single, live CD45+CD4+ cells (n = 4 for PLND, n = 5 for sham). d, e Representative FACS plots (d) and quantification (e) of single, live CD4+CCR5+CXCR3+ Th1 cells (n = 4 for PLND, n = 5 for sham). f, g Representative FACS plots (f) and quantification (g) of single, live CD4+CCR4+CCR8+ Th2 cells (n = 4 for PLND, n = 5 for sham). h Representative immunofluorescent images co-localizing CD4 and IFN-γ with inset images demonstrating CD4 alone (inset upper) and IFN-γ alone (inset lower); scale bar, 10 µm. Isotype control refers to use of control for IFN-γ in mice without CD4-GFP expression. i Quantification of CD4+IFN-γ+ cells per 0.25 mm2 (n = 5 per group; 4–5 hpf per mouse). j Representative immunofluorescent images co-localizing CD4 and IL-4 with inset images demonstrating CD4 alone (inset upper) and IL-4 alone (inset lower); scale bar, 10 µm. Isotype control refers to use of control for IL-4 in mice without CD4-GFP expression. k Quantification of CD4+IL-4+ cells per 0.25 mm2 (n = 5 per group; 4–5 hpf per mouse). Data representative of a minimum of two independent experiments with similar results; statistical analyses of one experiment shown. Mean ± s.d.; *P < 0.05, **P < 0.01, and ***P < 0.001 by unpaired student’s t-test. FACS, fluorescence-activated cell sorting; hpf, high-powered field; PLND, popliteal lymph node dissection; Th1, T helper type 1; Th2, T helper type 2

