Fig. 8.
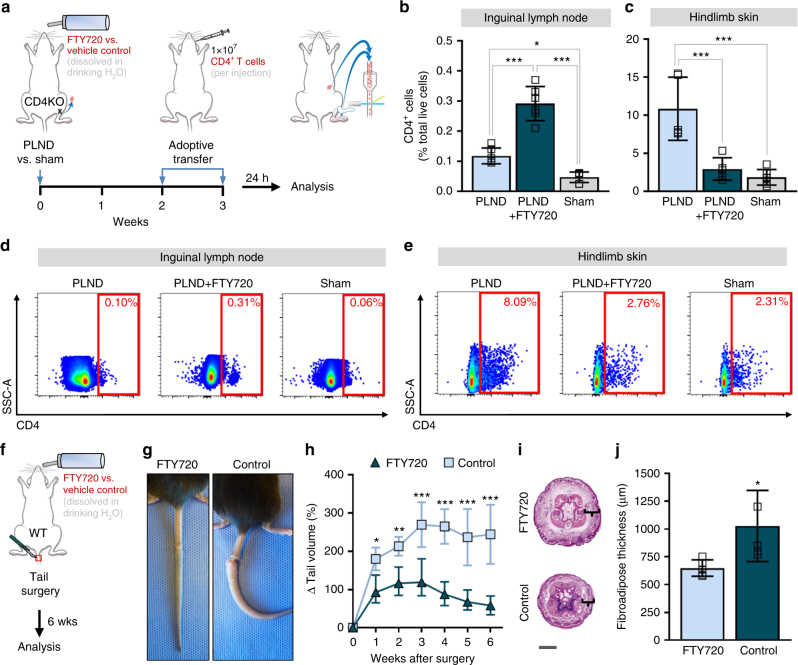
Inhibition of CD4+ T cell release from lymph nodes prevents lymphedema. a Schematic diagram of adoptive transfer following PLND or sham surgery in the setting of FTY720 treatment. Mice killed 3 weeks after surgery. b, c FACS quantification of CD4+ cells in ipsilateral inguinal lymph nodes (b) and hindlimb skin (c) (n = 6 per group). d, e Representative FACS plots of single, live CD4+ cells in ipsilateral inguinal lymph nodes (d) and hindlimb skin (e). f Schematic diagram of FTY720 treatment in WT mice following tail surgery. Mice killed 6 weeks after surgery. g Representative photographs of tails. h Quantification of tail volume change (n = 5 per group). i Representative H&E staining of tail cross-sections with brackets indicating fibroadipose tissue; scale bar, 2000 µm. j Quantification of fibroadipose thickness (n = 5 per group; 4 hpf per mouse). Data representative of a minimum of two independent experiments with similar results; statistical analyses of one experiment shown. Mean ± s.d.; *P < 0.05, **P < 0.01, and ***P < 0.001 by one-way ANOVA with Tukey’s multiple comparisons test or unpaired student’s t-test. FACS, fluorescence-activated cell sorting; H&E, hematoxylin and eosin; PLND, popliteal lymph node dissection

