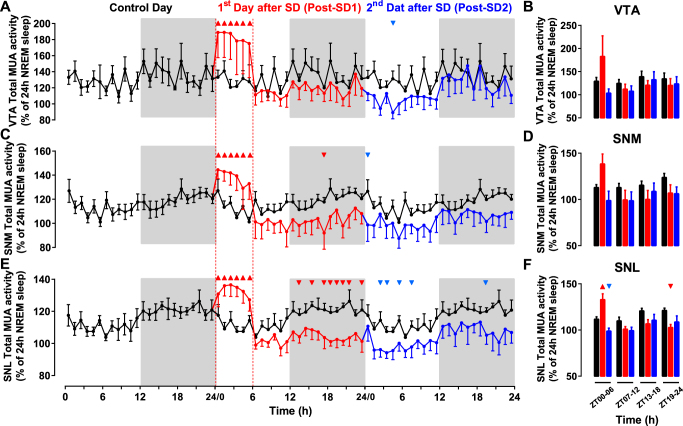
Figure 2.
Long-term effects of 6 hours of sleep deprivation (SD) on neuronal activity in the VTA and SN. (A,C,E) Time course of mean neuronal activity in the ventral tegmental area (VTA, n = 6), medial substantia nigra (SNM, n = 5) and lateral substantia nigra (SNL, n = 6) measured over three consecutive 24-hour periods. Activity is displayed in 1-hour intervals as a percentage of the mean activity measured during NREM sleep during the baseline day. SD was induced during the first 6 hours of the first day after baseline, and activity was measured during the 1st (red) and 2nd (blue) days after SD. For comparison, the data recorded during the baseline day in (A,C,E) are triple-plotted (black lines). The light and dark phases of LD cycles are indicated by the white and grey backgrounds respectively. During SD and in both the VTA (A) and SN (C,E) neuronal activity increased significantly compared to baseline. Triangles indicate significance with p < 0.05 (two-way repeated measures ANOVA followed by Dunnett’s test). (B,D,F) Relative mean neuronal activity measured in 6 h-bins in the VTA (B), SNM (D) and SNL (F) during control day (black bars), Post-SD1 (red bars) and Post-SD2 (blue bars). VTA, Ventral Tegmental Area; SNM, Medial Substantia Nigra; SNL, Lateral Substantia Nigra.

