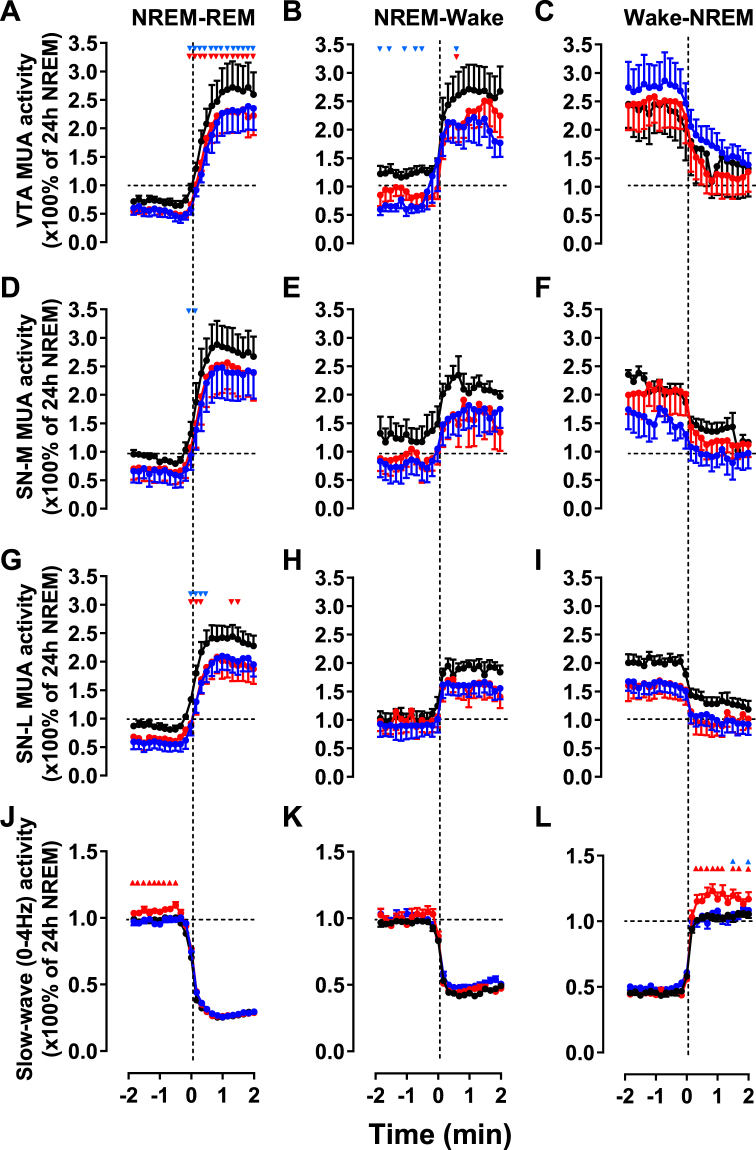
Figure 3.
Multi-unit activity during vigilance state transitions during baseline (black), SD day (red) and post-SD (blue). Time course of the VTA (A–C), SNM (D–F) and SNL (G–I) neuronal activity and EEG slow-wave activity (power density 0–4 Hz) at the transition from NREM to REM sleep (A,D,G,J), NREM to REM sleep (B,E,H,K) and wake to NREM sleep (C,F,I,L) during the 2 min before and after the vigilance state transition. The curves connect 10s mean-values calculated over the entire LD, SD and post-SD days. All variables are expressed as a percentage of the mean activity during NREM sleep over baseline. All changes at the transition were significant (p < 0.001, ANOVA factor ‘time’ over 24 10-s epochs). Black lines: Control day; Red lines: Post-SD1; Blue lines: Post-SD2. Additionally, red and blue triangles indicate significant changes of neuronal activity during SD and post-SD days (two-way repeated measures ANOVA followed by Dunnett’s test).

