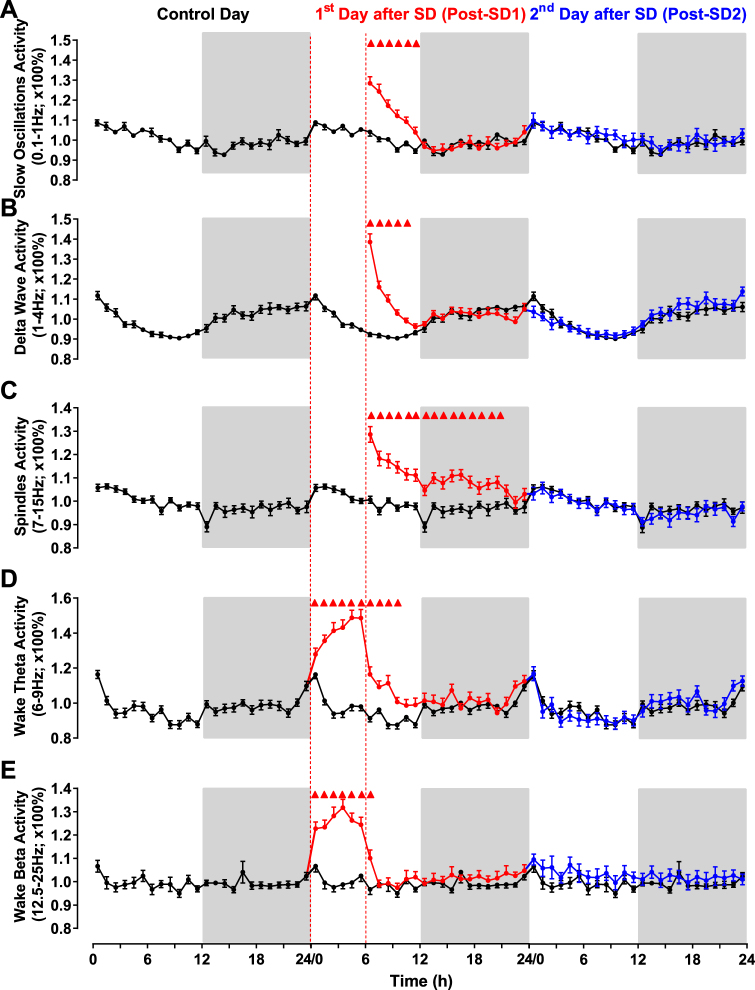
Figure 4.
Changes in cortical EEG power density following 6 h SD. (A–E) Time course of mean percentages of EEG slow oscillations activity (A), Delta wave activity (B), spindle frequency activity (C) during NREM sleep, and theta activity (D) and beta activity (E) during waking over the 72 h experimental protocol. Data are presented as a percentage of the mean activity (±s.e.m.) over the 24 h baseline day and averaged in 1h bins. The traces of the baseline day are triple-plotted in black for easy comparison. Values during the 6 h SD in (A–C) are omitted because the remaining ≈10% of NREM during this period are influenced by the SD intervention. The light and dark phases of LD cycles are indicated respectively by white and black shading in the background. Triangles indicate significance with p < 0.05 (two-way repeated measures ANOVA followed by Dunnett’s test).

