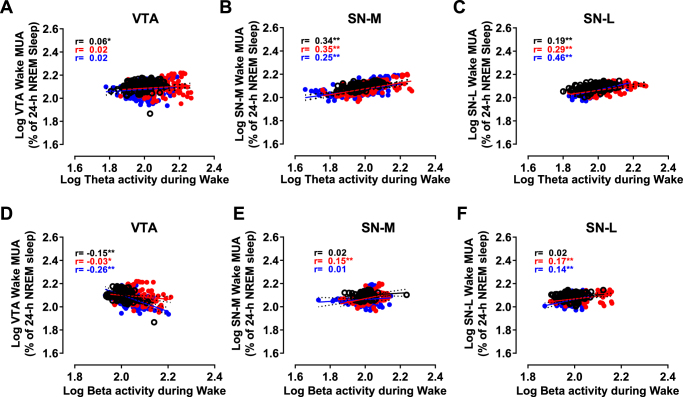
Figure 6.
Correlations between neuronal activity in the VTA (A,B), SNM (C,D) and SNL (E,F) in one hand and theta (A–C) and beta (D–F) activities measured from EEG signals during wakefulness. (A–F) Changes in mean firing rates in the VTA (A,D), SNM (B,E) and SNL (C,F) measured in 1-min bins as a function of the power density of theta activity (A–C) and beta activity (D–F). *p < 0.05, **p < 0.01 (Black circles: Control day; Red circles: Post-SD1; Blue circles: Post-SD2).

