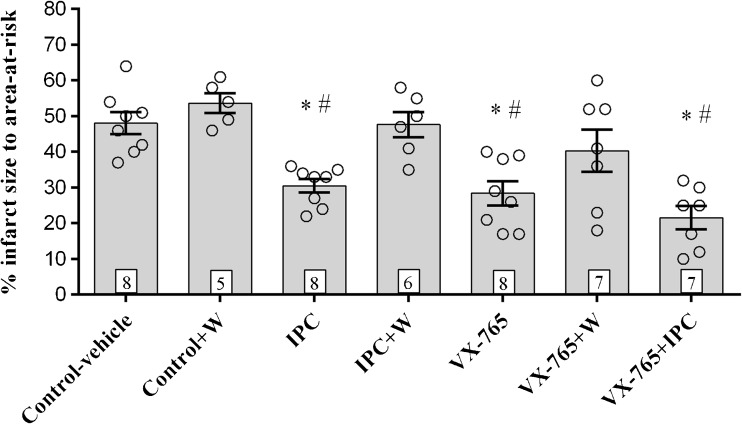
Fig. 2.
Infarct size as a percentage of area-at-risk represented as scatter plot and mean + standard error of the mean (SEM), with the number of hearts in each group indicated. The data was analysed by nonparametric Kruskal–Wallis test (one-way ANOVA) with Dunn’s multiple comparisons post hoc test. *P < 0.05 IPC, VX-765 and VX-765 vs control-vehicle; #P < 0.05 IPC, VX-765 and VX-765 vs control + W

