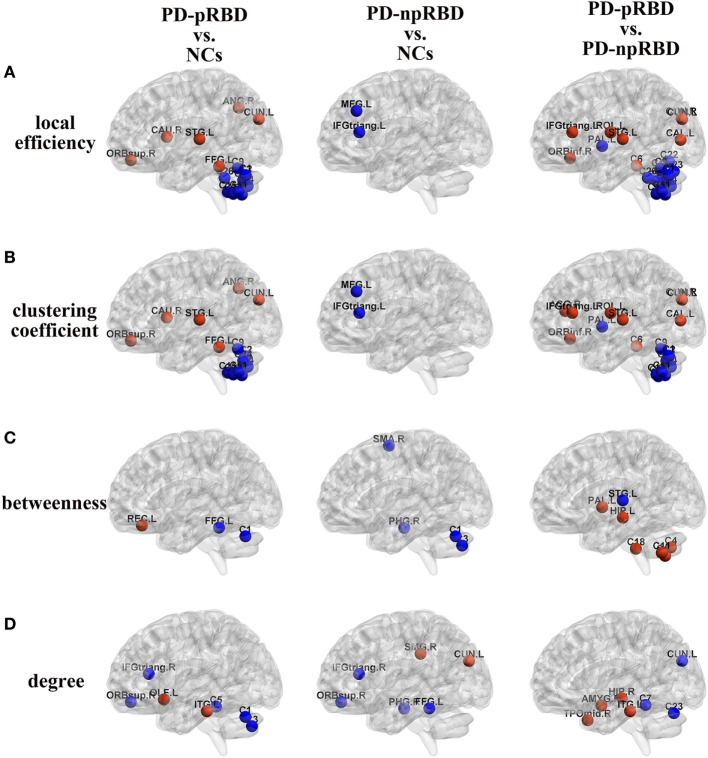
Figure 3.
Group differences of (A) local efficiency, (B) clustering coefficient, (C) betweenness, and (D) degree between any two groups [Parkinson’s disease (PD) patients with possible rapid eye movement sleep behavior disorder (RBD) (PD-pRBD) vs. normal controls (NCs), PD patients with non-possible RBD (PD-npRBD) vs. NCs and PD-pRBD vs. PD-npRBD]. The red (blue) nodes in three panels, respectively, indicated increased (decreased) regional network measures in PD-pRBD (vs. NCs), PD-npRBD (vs. NCs), and PD-pRBD (vs. PD-npRBD). The results were visualized using the BrainNet Viewer (Beijing Normal University, http://www.nitrc.org/projects/bnv/). Abbreviations were presented in Table S3 in Supplementary Material.

