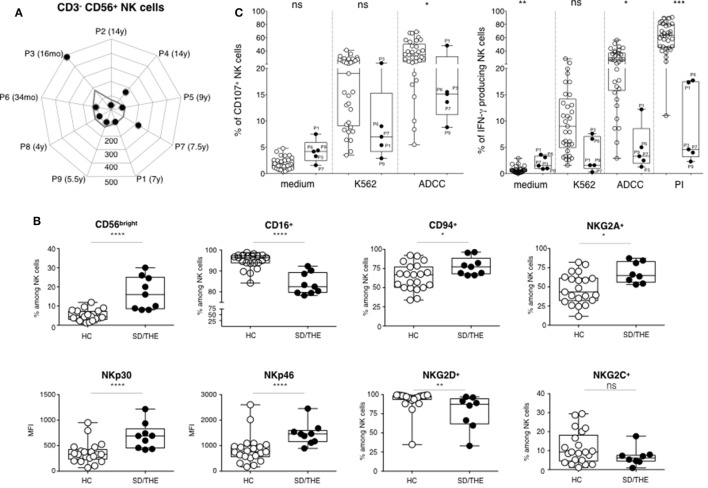
Figure 2.
Phenotypic and functional analysis of NK cells. (A) Absolute numbers of CD3−CD56+ NK cells (cells per μl). (B) Cell surface expression of the indicated molecules on NK cells among the peripheral blood lymphocytes from healthy controls HC (closed circles) and syndromic diarrhea/trichohepatoenteric syndrome (SD/THE) patients (open circles), given as a percentage of total NK cells or as median fluorescence intensity (MFI). (C) NK cell functions evaluated by their ability to release granules and to express CD107 at the cell surface (left panel) and to produce interferon gamma (right panel) after target cell contact or PMA/ionomycin (PI) activation as previously described (9). Healthy controls (n = 33) and patients (n = 5) are indicated as open circles and closed circles, respectively. Box-plot with medians, 25th–75th percentiles, and min–max values are shown. ns, not significant, p > 0.05; *p < 0.05; **p < 0.01; ***p < 0.001; ***p < 0.001; ***p < 0.001 (Mann–Whitney test).

