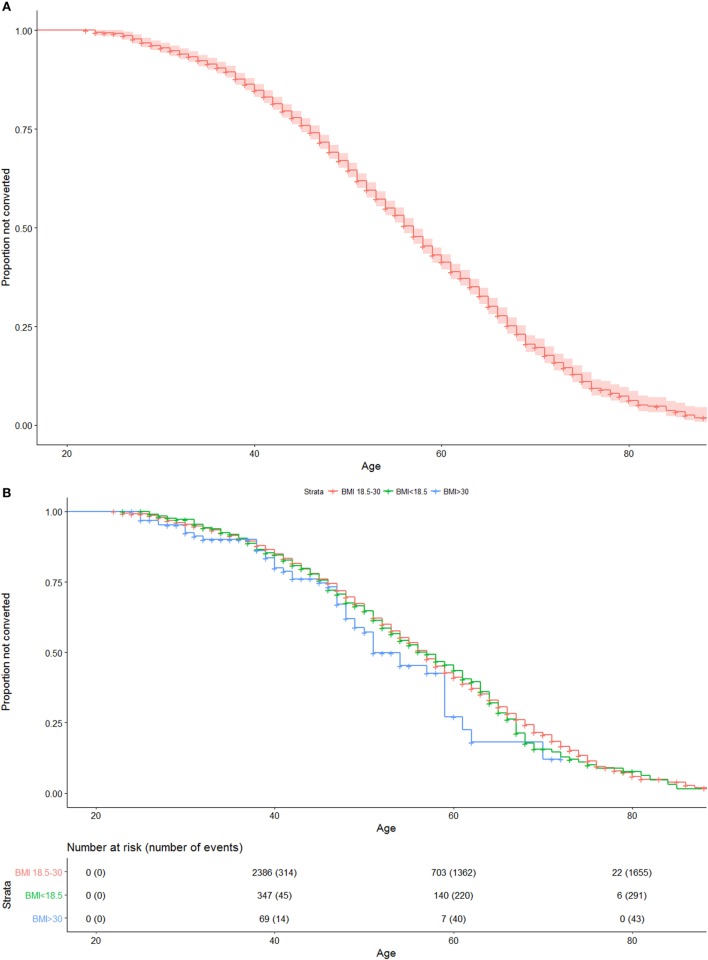
Figure 1.
(A) Uncorrected Kaplan–Meier plot of conversion to SPMS of entire cohort. Numbers at risk and cumulative numbers of events are presented. (B) Uncorrected Kaplan–Meier plot of conversion to SPMS of entire cohort, when stratified by body mass index (<18.5, 18.5–30, >30). Numbers at risk and cumulative numbers of events are presented.

