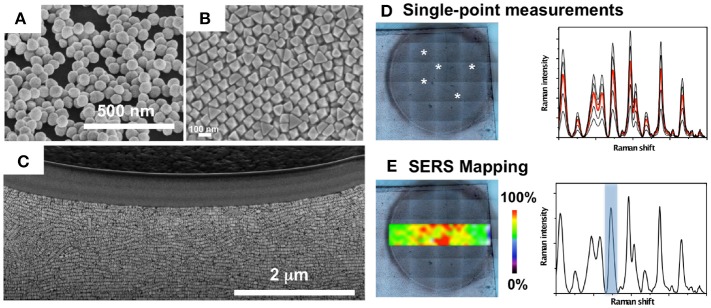
Figure 3.
Nanostructured plasmonic substrates for SERS spectroscopy. (A–C) Nanostructured plasmonic platforms: Clusters of gold nanoparticles (A), self-assembled gold octahedral nanoparticles (B), and gold nanorods supercrystals embedded in a silica layer (C). (D) Single-point SERS measurements on a bacterial colony (white asterisks) grown on a plasmonic nanostructured substrate, and recorded SERS spectra highlighting in red the mean spectrum. (E) SERS intensity mapping performed with the spectral peak indicated in the SERS spectrum with a blue bar. (A,D,E) Images reproduced with permission from Bodelón et al. (2017). (B) Image reproduced with permission from Gómez-Graña et al. (2015). (C) Image reproduced with permission from Hamon et al. (2016).

