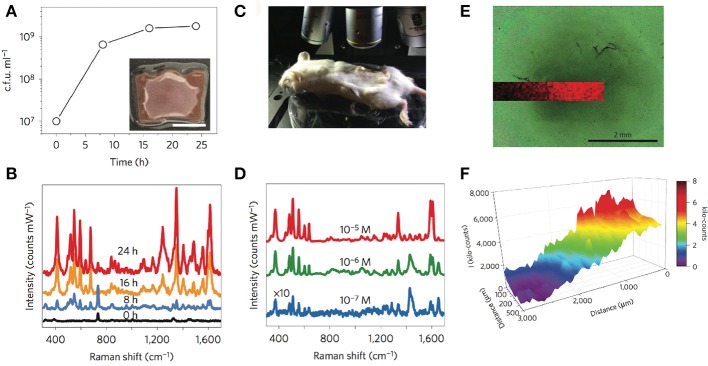
Figure 5.
In situ detection and imaging of pyocyanin secreted by P. aeruginosa PA14 colonies and biofilms grown on Au@pNIPAM hydrogels and mesoestructured Au@TiO2 thin films. (A) Graphical representation of viable bacteria (c.f.u. ml−1) quantified over time. The inset shows an image of the colony-biofilm grown on Au@pNIPAM (scale bar, 0.5 cm). (B) SERRS spectra recorded at the indicated times. Measurements of colony-biofilms were done using a 785 nm laser line for 10 s and using a maximum power of 0.91 kW cm−2 employing a 20× objective. (C) Photograph showing the Raman experimental set-up for detection of pyocyanin in subcutaneous implants in mice. (D) Under-skin SERRS spectra of pyocyanin spiked at the indicated concentrations on Au@pNIPAM hydrogel. SERRS measurements of pyocyanin-spiked hydrogels were performed using a 785 nm laser line for 10 s using a maximum power of 24.45 kW cm−2 employing a 10× objective. For clarity, the spectra noted with × 10 have been multiplied by a factor of 10. (E) Optical image of bacterial biofilm (dark central region) grown on Au@TiO2 substrate captured with the Raman microscope and superimposed pyocyanin SERRS mapping (418 cm−1) acquired with excitation laser wavelength of 785 nm, 5× objective and a laser power of 0.94 mW for 10 s. (F) Graphical representation of the SERRS intensity mapping shown in (E). Images reproduced with permission from Bodelón et al. (2016). Copyright © 2016, Springer Nature.

