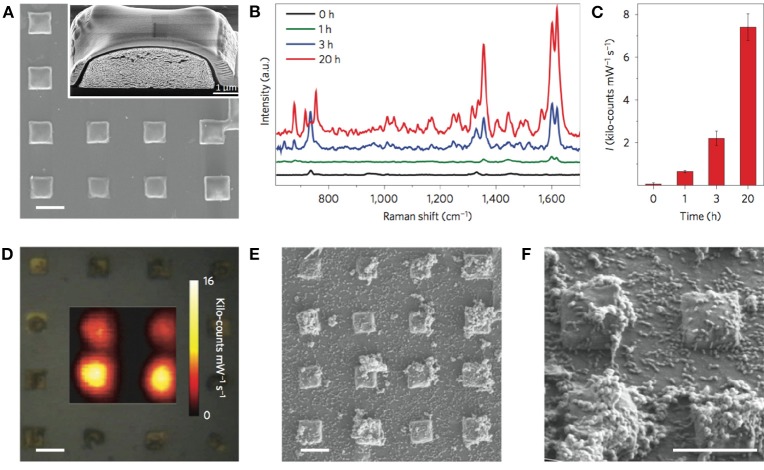
Figure 6.
In situ detection and imaging of pyocyanin secreted by P. aeruginosa PA14 biofilms grown on micropatterned Au@SiO2 supercrystals. (A) SEM images of micropatterned Au@SiO2 supercrystals. Scale bar, 5 μm. The inset shows a cross-section SEM image of a Au@SiO2 supercrystal. (B) Representative SERRS spectra measured at 0, 1, 3, and 20 h. (C) Relative SERRS intensities (1,600 cm−1) recorded at 0, 1, 3, and 20 h. Error bars indicate standard deviation. (D) Optical image of the substrate and SERRS mapping of pyocyanin (1,600 cm−1) recorded at 20 h of growth. Scale bar, 5 μm. (E,F) SEM images of Au@SiO2 supercrystals colonized by P. aeruginosa (20 h) at different magnifications. Scale bars, 5 μm. All SERS measurements were carried out with a 785 nm laser line, 50× objective and a maximum power of 0.98 kW cm−2. The acquisition time was 0.1 s. Images reproduced with permission from Bodelón et al. (2016).

