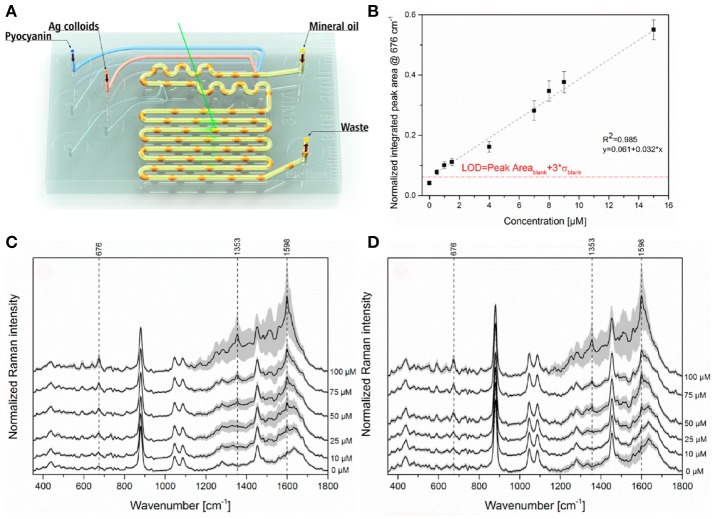
Figure 7.
LoC-SERS approach for detection of pyocyanin in saliva. (A) Schematic representation of the droplet based microfluidic chip used for LoC-SERS measurements. (B) Calibration curve for the determination of pyocyanin relative concentration in aqueous solution. The peak area ratio of the 676 cm−1 and 240 cm−1 Raman modes as a function of pyocyanin concentration in aqueous solution in the range between 0.5 and 15 μM with linear fitting. The red line indicates the calculated LOD. (C,D) Average SERS spectra and their double standard deviation of the different concentrations of pyocyanin in the saliva sample from volunteer number one (C), two (D). Images reproduced with permission from Žukovskaja et al. (2017).

