Figure 8.
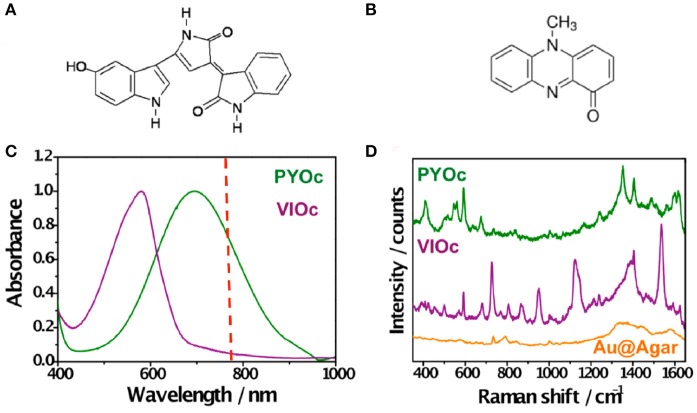
Detection of violacein and pyocyanin on Au@agar by SERS/SERRS. (A,B) Chemical structures of violacein and pyocyanin, respectively. (C) Normalized visible–NIR spectra of commercial pyocyanin (PYOc) and violacein (VIOc). The dashed red line indicates the laser wavelength used (785 nm). (D) SERRS spectrum of PYOc, SERS spectrum of VIOc, and SERS spectrum of Au@agar. All spectra were measured with a 50× objective, a maximum power of 0.64 kWcm−2, and an acquisition time of 10 s. Excitation laser line was 785 nm. Images reproduced with permission from Bodelón et al. (2017).

