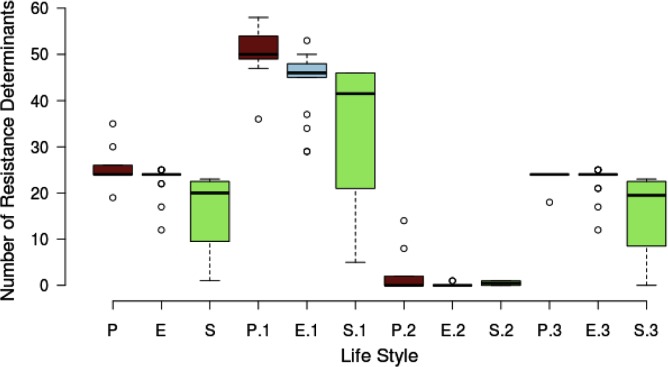
FIGURE 6.
Box plot showing the relationship between the number of resistance determinants and the lifestyle of the strains. There are 3 main lifestyle groups, nosocomial/pathogen [P (brown)], environmental/free living [E (blue)] and environmental/symbiotic [S (green)]. P, E, and S represent the total resistance determinants. P.1, E.1, and S.1 are the total efflux pump genes. P.2, E.2, and S.2 represent the acquired resistance genes and P.3, E.3, and S.3 the intrinsic AGRs.

