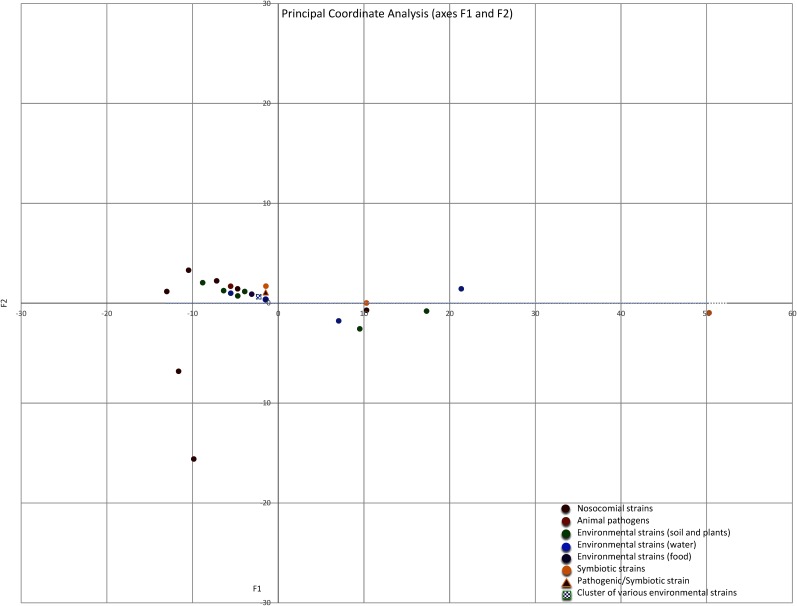
FIGURE 8.
Principal Coordinate Analysis (PCoA) plot depicting Euclidean distances between resistomes of nosocomial strains (red), animal pathogens (orange), environmental associated with soil and plants (green), environmental isolated from water (blue), environmental isolated from food (purple), and environmental symbiotic bacteria (yellow) calculated using ARGs counts. The blue and green square represents a group of many strains isolated from water and soil/plants, the triangle represents de pathogen/symbiotic strain S. nematodiphila.

