
FIGURE 4.
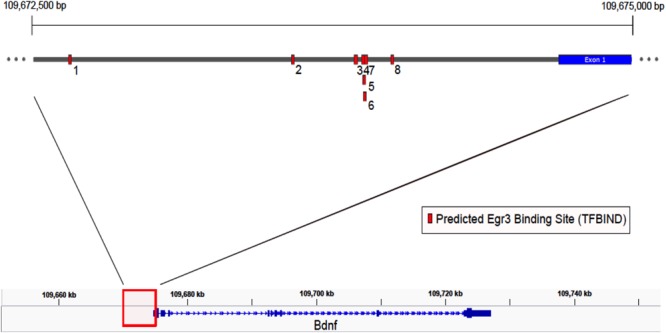
Map of predicted EGR3 binding sites in Bdnf upstream region. EGR3 binding sites identified in Table 1 are indicated in red. Positions are shown relative to exon 1 of the mouse Bdnf gene as identified in the NCBI Refseq database. Numbers under each binding site correspond to numbered rows in Table 1.