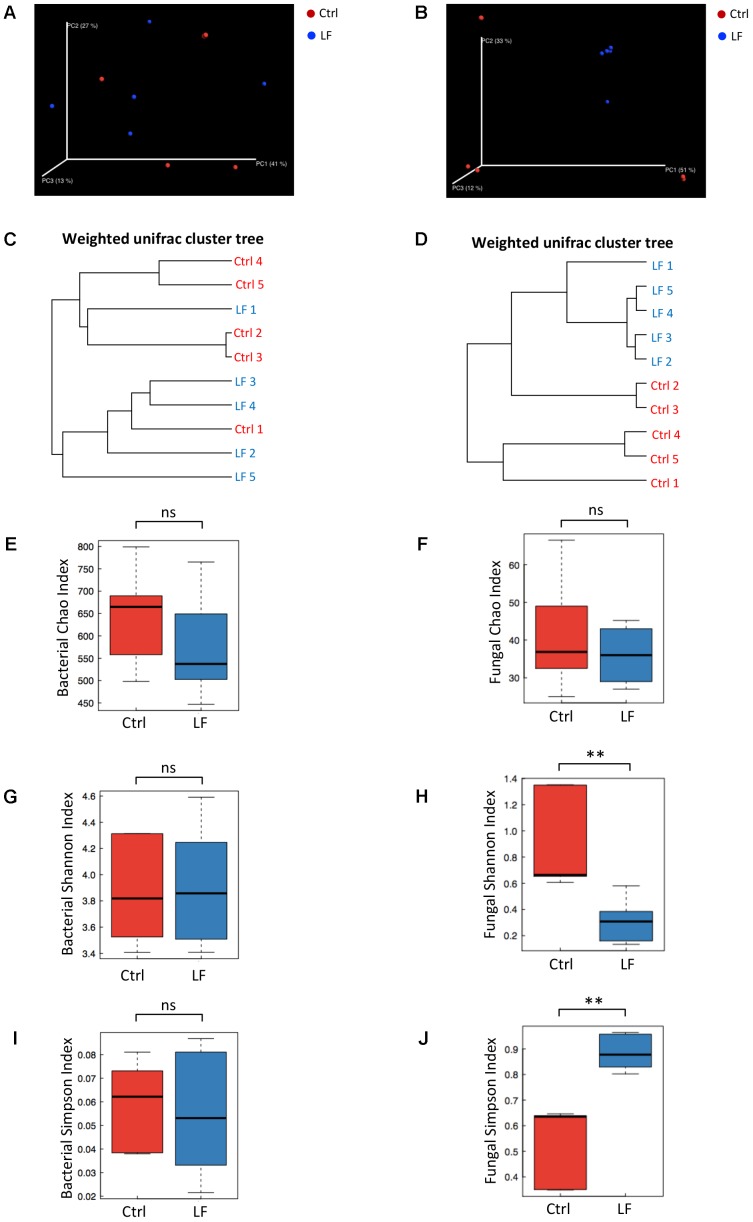
FIGURE 6.
The changes of intestinal microbial diversities in early-weaned piglets with oral administration of L. frumenti. (A,B) Scatterplots from principal coordinates analysis (PCoA), based on weighted UniFrac distance in bacterial communities (A) and fungal communities (B) (Ctrl, Control; LF, L. frumenti). (C,D) Cluster tree analyses based on weighted UniFrac distance in bacterial communities (C) and fungal communities (D). (E,F) The alpha diversities determined by Chao index in bacterial communities (E) and fungal communities (F). Data are represented as mean ± SEM (n = 5; ns, not significant, p > 0.05). (G,H) The alpha diversities determined by Shannon index in bacterial communities (G) and fungal communities (H). Data are represented as mean ± SEM (n = 5; ∗∗p < 0.01, ns, not significant, p > 0.05). (I,J) The alpha diversities determined by Simpson index in bacterial communities (I) and fungal communities (J). Data are represented as mean ± SEM (n = 5; ∗∗p < 0.01, ns, not significant, p > 0.05).

