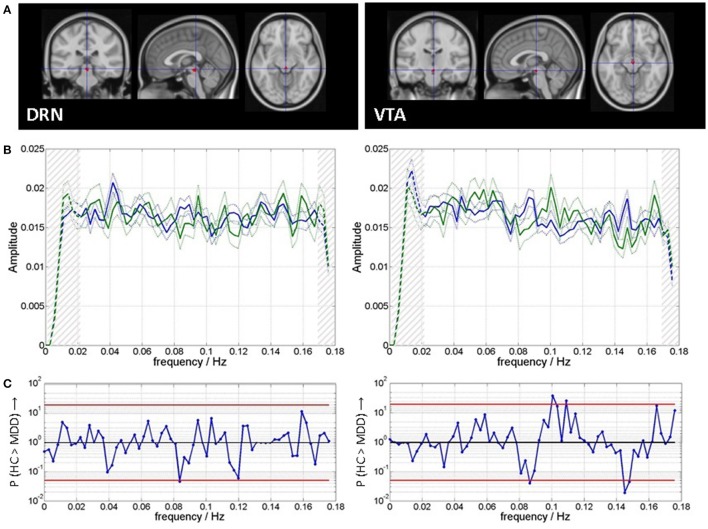
Figure 2.
(A) Regions of interest for time course extraction and (B) mean and standard error of mean of spectra for patients (blue) and healthy controls (green). Clipping of spectra in subsequent analyses is indicated by hatching on both ends of the spectra. (C) Spectral group differences are indicated as P-values from Wilcoxon rank sum tests the red lines indicate P = 0.05, uncorrected for multiple comparisons.

