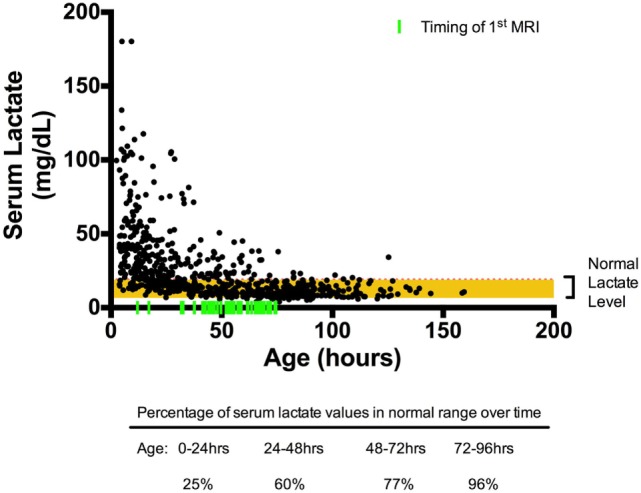
Figure 1.

Scatter plot of serum lactate measured over time. All serum lactate values in black circles were plotted over time (n = 780) with timing of first MRI indicated by fluorescent green vertical line. The red horizontal line marks the upper limit of normal serum lactate level (19 mg/dL). By 72–96 h of life, 96% percent of the serum lactate values are within reference range.
