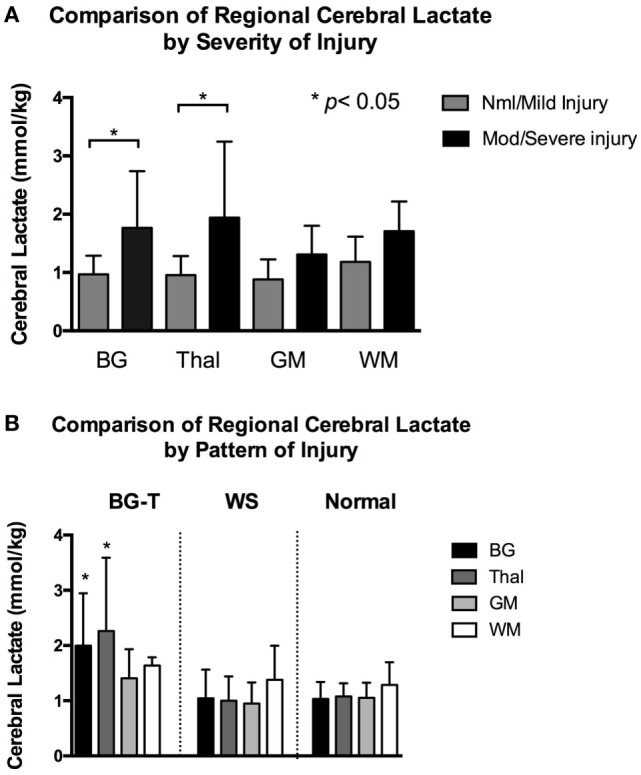
Figure 3.

(A) Mean regional cerebral lactate concentration during hypothermia in relation to severity of injury. Compared to infants with normal/mild injury, infants with moderate/severe had significantly higher cerebral lactate concentration at the basal ganglia (BG) and thalamus (Thal) regions (denoted by *p < 0.001). There was no significant difference in regional cerebral lactate concentration among the normal/mild injury group. There was also no significant difference in regional cerebral lactate concentration among the moderate/severe injury group. Gray color bars represent normal/mild injury and black bars represent moderate/severe injury. Error bars represent SD. (B) Mean regional cerebral lactate concentration during hypothermia in relation to pattern of injury. Infants with predominantly BG-Thal pattern of brain injury had significantly higher cerebral lactate concentration at regions BG and Thal (denoted by *p < 0.05), compared to infants with watershed or normal pattern of injury. Black bars represent cerebral lactate concentration measured at BG. Dark gray bars represent Thal. Light gray bars represent gray matter (GM). White bars represent white matter (WM). Error bars represent SD.
