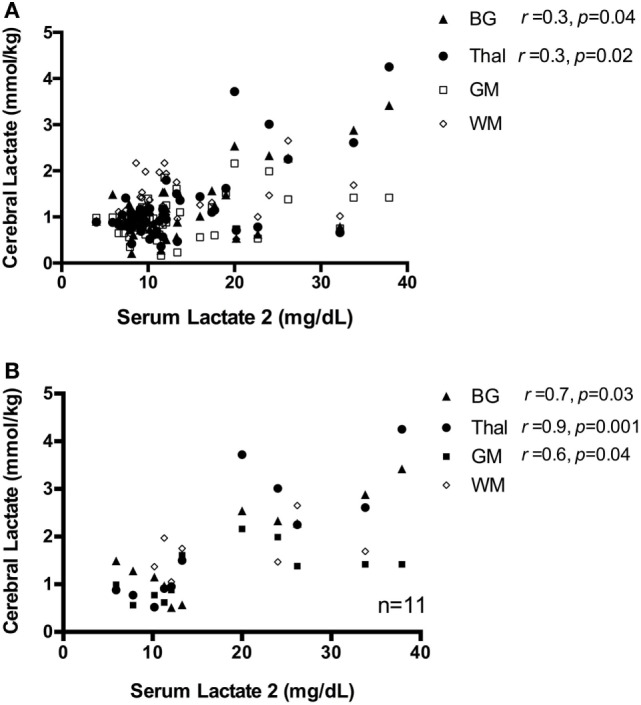
Figure 4.

(A) Scatter plot of serum Lactate 2 vs. cerebral lactate, all patients. There is a weak correlation between serum Lactate 2 and cerebral lactate concentration, only at regions basal ganglia (BG) and Thal, shown as closed triangle and closed circle, respectively. There is no significant correlation between serum lactate and cerebral lactate at regions gray matter (GM) and white matter (WM), denoted as open square and diamond in the graph. (B) Scatter plot of serum Lactate 2 vs. cerebral lactate in infants with moderate–severe injury. For subjects with moderate–severe injury, there is a strong correlation between serum Lactate 2 and cerebral lactate at the BG, Thal, and GM region, which are denoted here in closed triangle, closed circle, and closed square, respectively. There is no significant correlation between serum lactate and WM lactate, denoted as open diamond in the graph.
