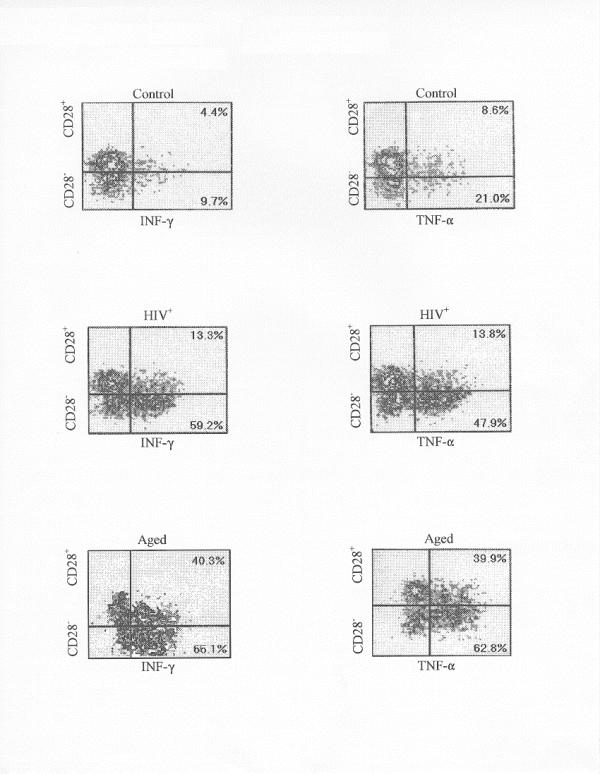
Figure 2.

The distribution of CD8+ T cells are shown as obtained from PBMC by four color flow cytometry using anti-CD28-PE and anti-IFN-γ-FITC (or anti-TNF-α-FITC) as described in METHODS. The CD28+ and CD28- cells distribute vertically and the IFN-γ or TNF-α positive cells distribute horizontally according to their intensity. The percentage of the CD8+ CD28+ or CD8+ CD28- T cells which contains cytokine are shown in the right quadrants. Cells were activated with anti-CD3 and PMA as described in METHODS. The controls refers to cells from a normal young donor. The HIV+ and aged samples were derived from typical donors.
