Figure 3.
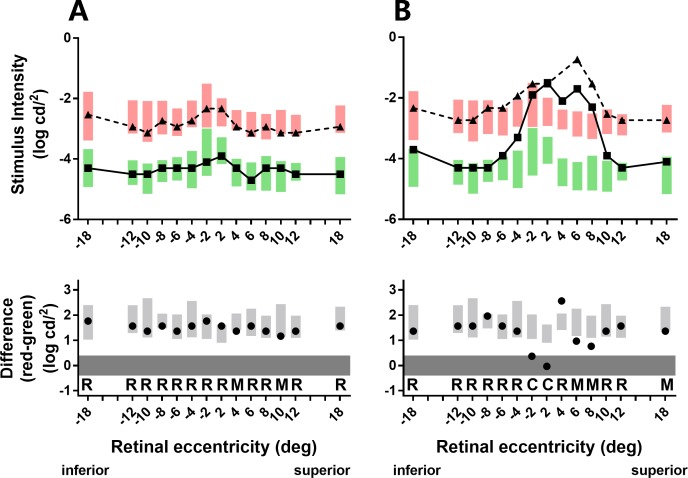
Scotopic thresholds to red (triangles and dashed lines) and green (squares and solid lines) stimuli and the difference between these two thresholds (circles) from participants representative of each rod function phenotype. Participants: (A) group 1, 68 years old, BCVA = 20/25; (B) group SDD, 78 years old, BCVA = 20/32. Green and red bars indicate the reference ranges (group 0; mean ± 2 SD) for the green and red stimuli, respectively; gray bars similarly indicate the reference range for the threshold differences (red minus green). The letters “R,” “C,” and “M” in the different parts of the figure indicate, respectively, whether scotopic thresholds at each eccentricity were mediated by rods only, cones only, or a mixed response of both rods and cones. Negative eccentricities correspond to the inferior retina, positive eccentricities to the superior retina.

