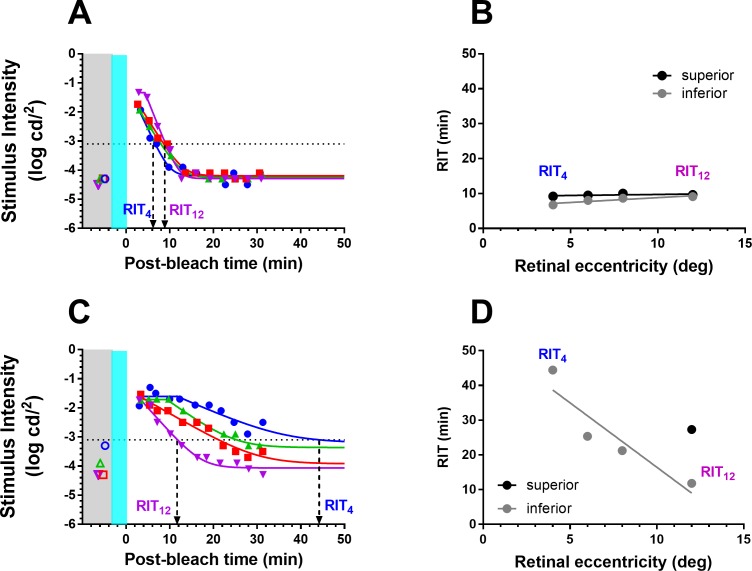
Figure 5.
Measurement of dark adaptation across four retinal eccentricities for the same group 1 (A) and SDD (C) participants from Figure 3. Solid lines are the fits of Equation A1 (Appendix). Colored open symbols in the gray region show the scotopic thresholds recorded at the same retinal eccentricity as dark adaptation. The gray and teal regions illustrate time of the measurement of scotopic threshold and delivery of the bleach, respectively. They are for graphic illustration only and are not drawn to scale. The black dotted line indicates the criterion stimulus intensity (−3.1 log cd/m2) used for calculation of RIT (Equation A2, Appendix). Derivation of RIT at 4° (RIT4) and 12° (RIT12) is indicated by the downward arrows. (A) RIT4 = 6.7 minutes; RIT12 = 9.1 minutes; (C) RIT4 = 44.5 minutes; RIT12 = 11.8 minutes. (B, D) RIT plotted as a function of retinal eccentricity for the two participants. RITslope was derived from the linear fit (lines) of RIT versus retinal eccentricity. Black and gray symbols/lines indicate data from the superior and inferior retina, respectively. RIT could be derived only at 12° in the superior retina for the participant shown in (D).

