
Figure 7.
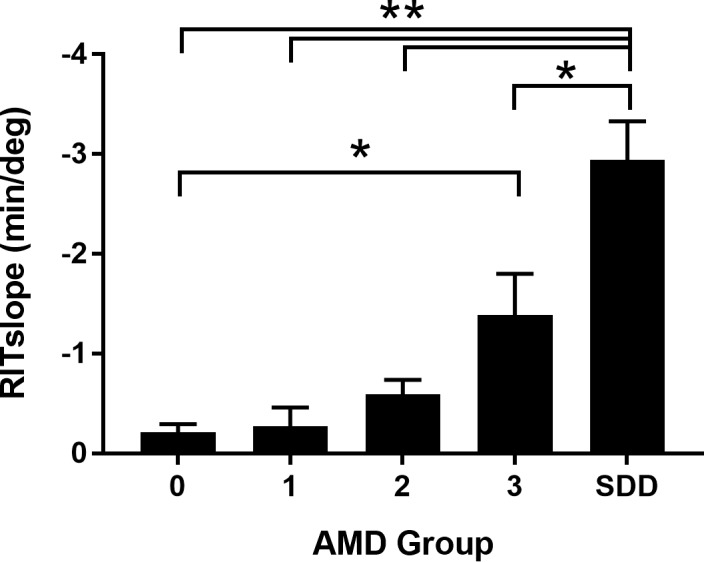
Bar graph showing mean RITslopeInf for each AMD severity group. Comparisons to group SDD: **P = 0.0001; *P = 0.002; comparison of group 3 to group 0: *P = 0.008. Number of subjects in whom RITslopeInf could be calculated: group 0, n = 8, group 1, n = 7, group 2, n = 11, group 3, n = 8, SDD, n = 5. Error bars indicate SEM.