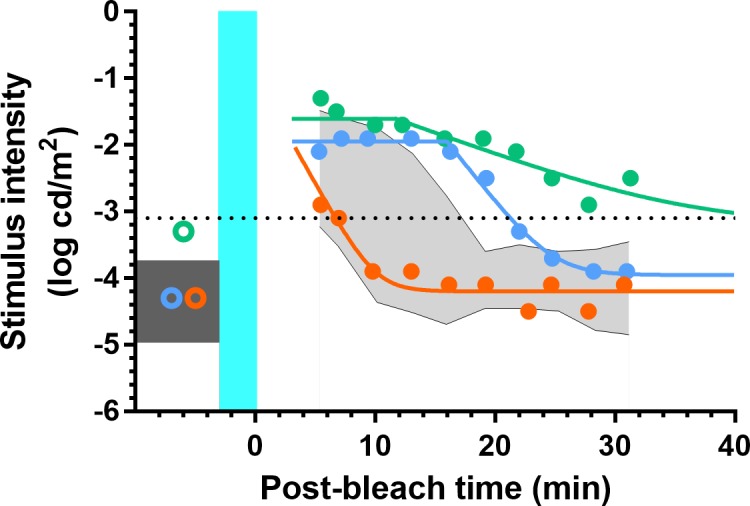
Figure 9.

Scotopic thresholds and dark adaptation measured from the inferior retina at 4°. For the RF1 participant (orange), scotopic threshold was within the reference range (dark gray box) as was the rate of dark adaptation (reference range: shaded gray area). For the RF2 participant (blue), scotopic threshold was also within the reference range, but dark adaptation was delayed. For the RF3 participant (green), scotopic threshold was elevated outside the reference range and dark adaptation was clearly slowed. The teal region indicates the background bleaching light and is not drawn to scale. The black dotted line indicates the criterion stimulus intensity (−3.1 log cd/m2) used for calculation of RIT (Equation A2).
