
Figure 10.
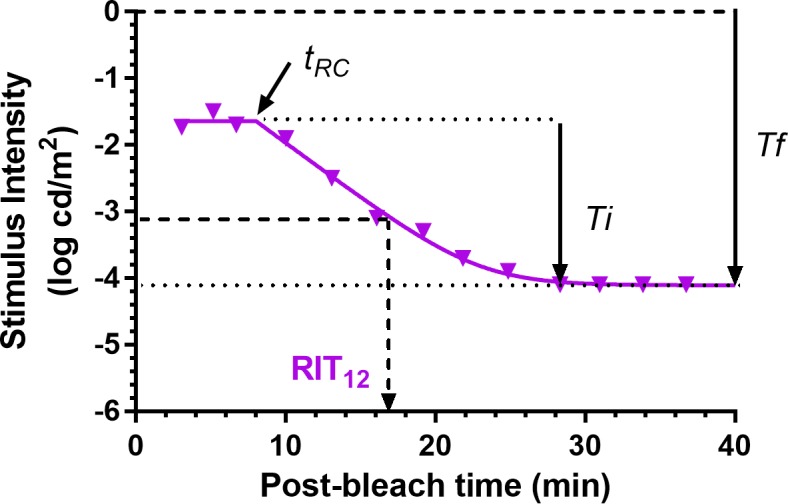
Dark adaptation curve showing the derivation of parameters from Equation A1. Derived parameters were  (log cd/m2), the asymptotic or “final” threshold; Ti (log cd/m2), the elevation in threshold above the asymptote prior to the rod–cone break;
  (min), the time to the rod–cone break. The recovery parameter R (decades/min) describes the rate of rod decay and can be thought of as the curvature of the fit. The black dotted line indicates the criterion stimulus intensity (−3.1 log cd/m2) used for calculation of RIT (Equation A2).