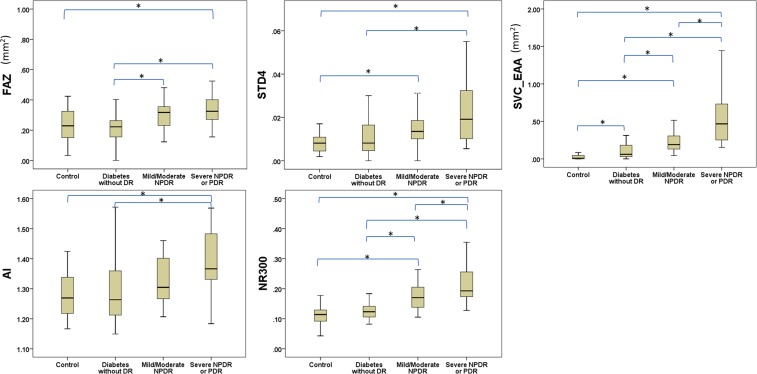
Figure 6.
Boxplots showing variation in quantitative foveal avascular zone metrics and extrafoveal avascular area between healthy eyes and varying diabetic retinopathy level. P values were adjusted by Holm-Bonferroni method and the significant difference between groups is represented by an asterisk (*).

