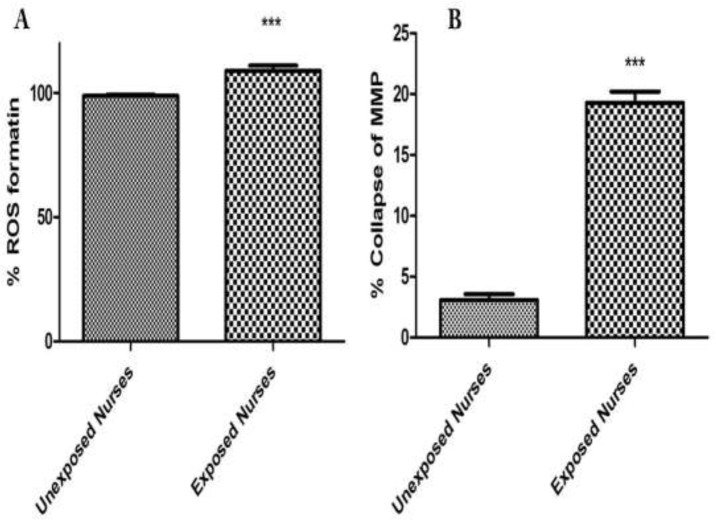
Figure 1.
ROS formation (A) and MMP collapse (B) assay in lymphocytes. ROS formation was measured fuorometrically using DCF-DA as described in materials and methods. Also collapse of MMP was measured by rhodamine 123 as described in materials and methods. Each bar represents mean SEM. Each group consisted of 50 individuals. *** p < 0.001 significant difference compared to the unexposed group

