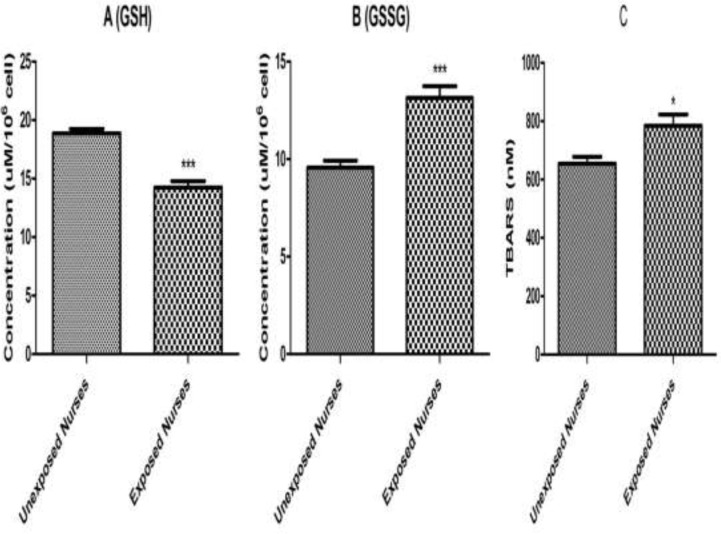
Figure 3.
GSH (A), GSSG (B) and MDA (C). Lymphocytes (106 cells/mL) were suspended in the RPMI 1640 at 37 oC. Intracellular GSH and extra cellular GSSG were fluorimetrically determined. Also, TBARS formation was expressed as nM concentrations. Each bar represents mean SEM. Each group consisted of 50 individuals. *** p < 0.001 significant difference compared to the unexposed group

