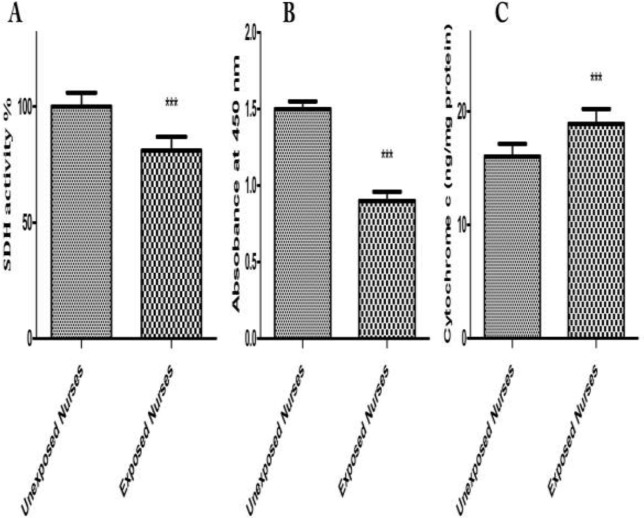
Figure 4.
SDH activity (A), mitochondrial swelling (B) and cytochrome c (C). Mitochondrial SDH activity were measured by kit at 1 h. Mitochondrial swelling was measured at 30 min, by determination of absorbance decline at 540 nm. Cytochrome c release was measured by ELISA kit as described in Experimental methods. Each bar represents mean SEM. Each group consisted of 50 individuals*** p < 0.001 significant difference compared to the unexposed group

