Figure 3.

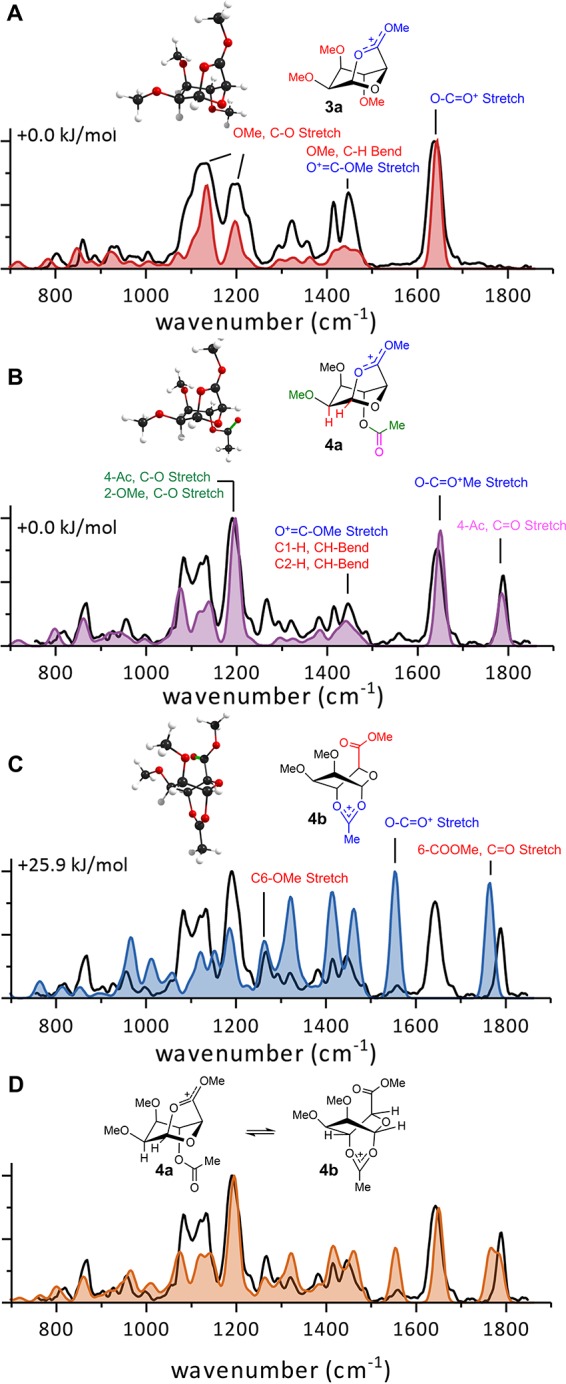
Comparison of calculated spectra (filled) with the measured IR ion spectra (black line) of mannuronic acids 3a, 4a, 4b (A–C) and a mixture of isomers 4a and 4b (D).

Comparison of calculated spectra (filled) with the measured IR ion spectra (black line) of mannuronic acids 3a, 4a, 4b (A–C) and a mixture of isomers 4a and 4b (D).