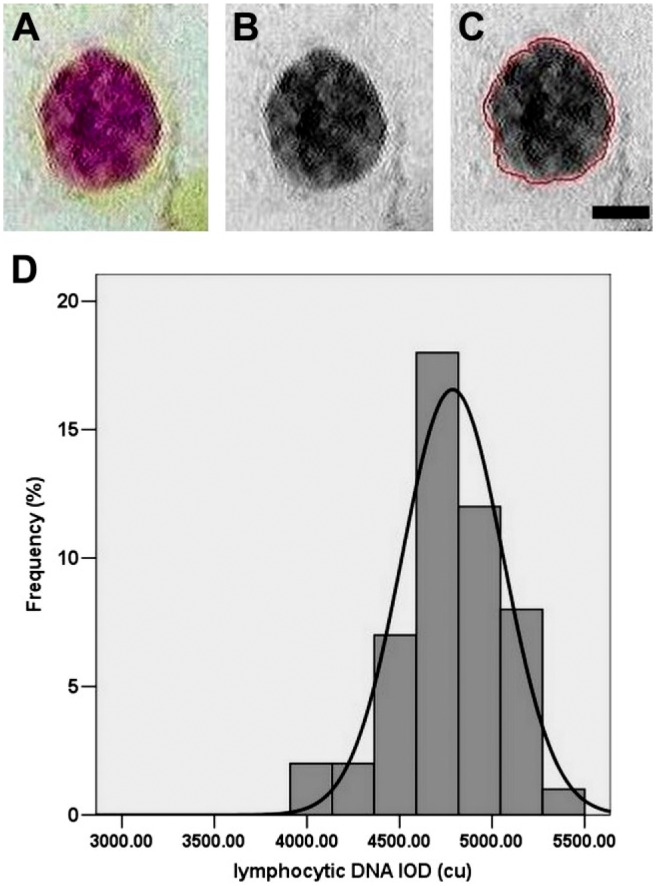
Figure 1.

Distribution frequency of standard IOD values on human diploid cells. (A, B, and C) Sequential steps for implementing image cytophotometry measurements (A) after Feulgen staining. (B) Converted to gray scale to avoid the Naphthol yellow contamination. (C) Mark the clear nuclear for DNA evaluation. (D) Significant local maximum of the DNA histogram peak. Images are obtained from image photocytometry. Scale bar = 5 µm. Abbreviation: IOD, Integrated Optical Density.
