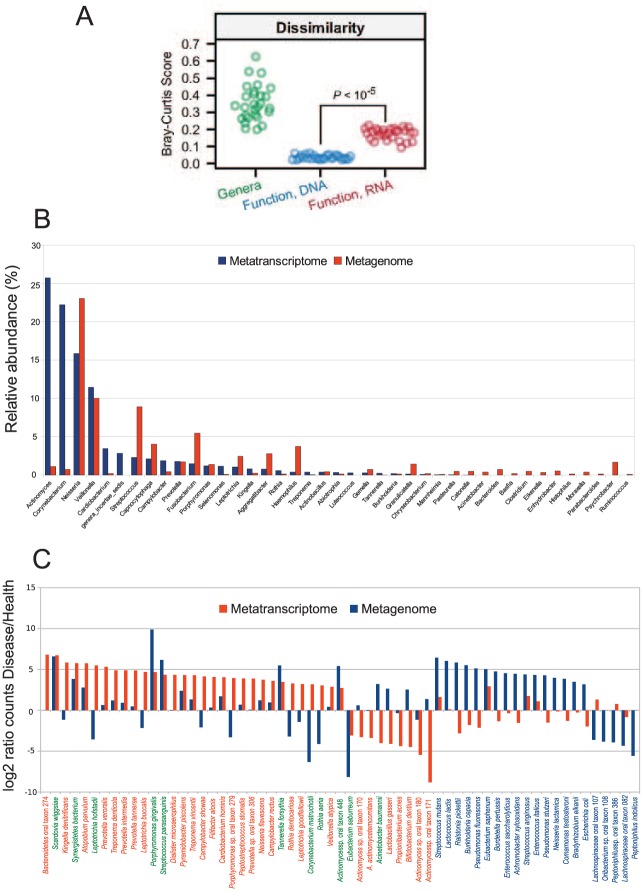
Figure 2.
Comparison of metagenome and metatranscriptome in the oral and gut microbiome. (A) Metagenome and metatranscriptome analysis of the gut microbiome. Comparison of between-sample diversity for taxonomic and functional profiles with the Bray-Curtis metric (adapted with permissions from Franzosa et al. 2014). (B) Microbiota composition in the human oral biofilm from a 24-h dental plaque sample. Relative abundance of bacterial genera from metagenomic data differs from that obtained from metatranscriptomic data (adapted from Benítez-Páez et al. 2014). (C) Rank distribution of statistically significant relative increase in number of hits for the metagenome and metatranscriptome results in samples from healthy patients and patients with severe periodontitis. In green, species with statistical differences in both metagenome and metatranscriptome. In blue, species with statistical differences in metagenomic counts. In red, species with statistical differences in metatranscriptome counts (adapted from Duran-Pinedo et al. 2014).

