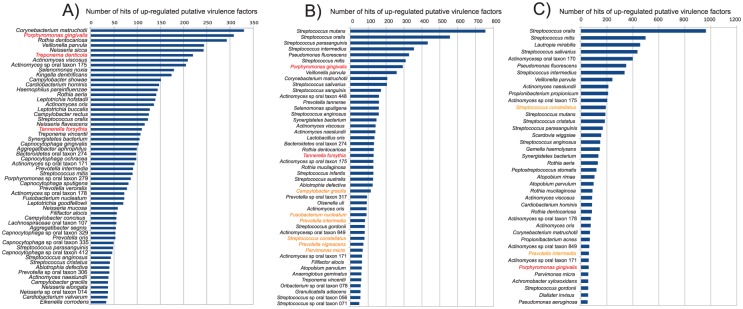
Figure 4.
Ranked species by the number of upregulated putative virulence factors in the metatranscriptome. Putative virulence factors were identified by alignment of the protein sequences from the different genomes against the Virulence Factors of Pathogenic Bacteria Database. The numbers in the graph are the absolute number of hits for the different species of the upregulated putative virulence factors identified. In red are the members of the “red complex.” In orange are members of the “orange complex.” (A) Comparison of health vs. severe periodontitis. (B) Comparison of baseline vs. progressing sites in periodontitis progression (adapted from Yost et al. 2015). (C) Comparison of baseline nonprogressing vs. baseline progressing in periodontitis progression. (Adapted from Duran-Pinedo et al. 2014 and Yost et al. 2015.)

