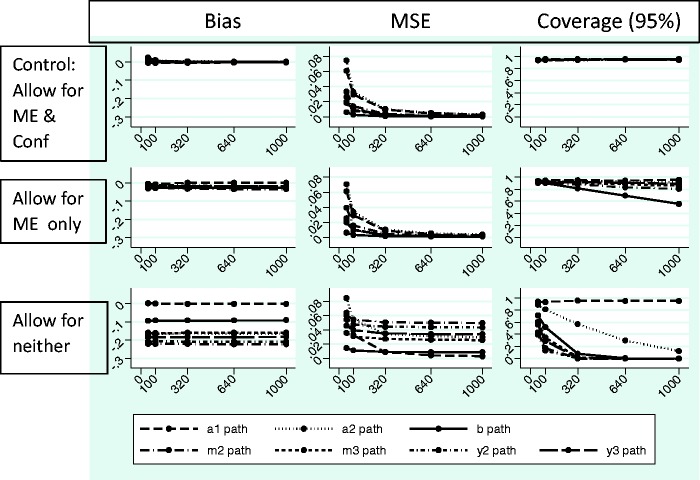
Figure 10.
Simulation results – measurement error and confounding present.
All data generated using simplex models and 1500 repetitions for each sample size allowing for measurement error (ME) and for measurement error covariances representing unmeasured confounding (Conf). MSE: mean square error; Control: generated and analysed with ME and Conf when both ME & Conf present; Allow for ME only: analyse allowing ME only when both ME & Conf present; Allow for neither: analysed without allowing for ME or Conf when both ME & Conf present.

