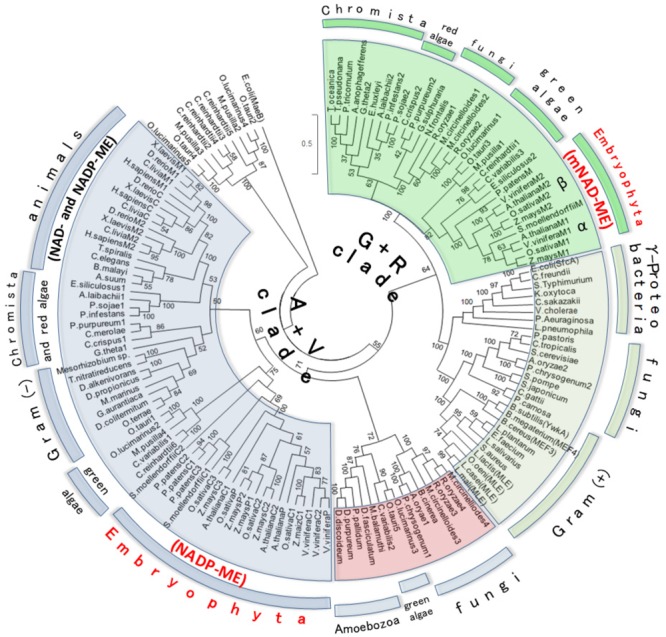
FIGURE 3.

Maximum likelihood tree of Class I-ME protein sequences. Evolutionary history was inferred by using the ML method based on the WAG + G (2.0533) + I (2.6198) evolutionary model. The tree with the highest log likelihood (–73118.4895) is shown. Analysis involved 134 amino acid sequences (see Supplementary Table S1 for list of gene IDs). All positions with less than 95% site coverage were eliminated. The final data set comprised a total of 491 positions. The tree is drawn to scale, with branch distance separating two taxa measured in the number of substitutions per site. Numerals indicate support of branches, which were assessed using 500 boostrap replicates. MaeB sequence from E. coli (a Class II-ME) was included in the analysis as out-group. For animal and plant MEs, M, P, and C indicate mitochondrial, plastidic, and cytosolic isoforms, respectively. The A+V Clade groups Animalia + Viridiplantae MEs, while G+R Clade clusters green + red isoforms. Plant ME family members, which are distributed between A+V and G+R lineages, are highlighted in red letters. α and β indicate the two plant mNAD-ME isoforms.
