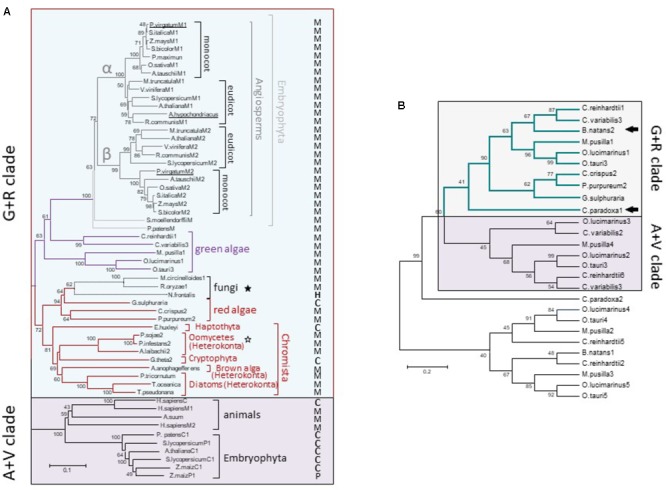
FIGURE 4.

Phylogenetic tree of G+R clade of Class I-ME (A) and inclusion of C. paradoxa and B. natans MEs (B). (A) Maximum likelihood tree of ME sequences focusing on the G+R clade. Methods are the same as in Figure 3 [WAG + G(2.0533) + I(2.6198) model]. The tree is drawn to scale, with branch lengths measured in the number of substitutions per site. M, P, H, and C indicate mitochondrial, plastidic, hydrogenosomal, or cytosolic location, respectively. Stars indicate non-photosynthetic organisms with proved (empty stars) or not proved (filled stars) photosynthetic past. (B) Maximum likelihood tree constructed (WAG model) with 240 amino acid ME sequences from green and red algae along with the available translated protein regions from the glaucophyte Cyanophora paradoxa and the secondary photosynthetic Bigelowiella natans (see Supplementary Table S1 for details). Arrows indicate C. paradoxa and B. natans sequences included into the G+R clade. In both trees, numerals indicate support of branches with 500 boostrap replicates.
