
FIGURE 5.
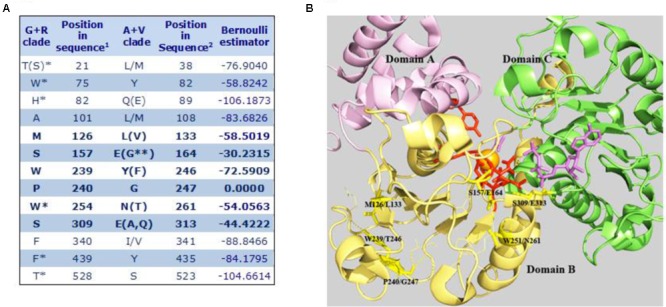
Specificity-determining position in MEs of the A+V and R+G clades. (A) 1Amino acid positions in the primary sequence of α mNAD-ME from A. thaliana. 2Amino acid positions in human mNAD-ME. Residues between parentheses show a frequency of occurrence lower than 10%. Residues on the right side of bars show a frequency of occurrence higher than 10%. ∗Corresponds to SDPs identified only when embryophyte G+R sequences were compared with all A+V groupings. ∗∗Corresponds to one residue found only in plastidic NADP-ME from Setaria italica. Letters in bold indicate SDPs with the highest z-scores that were defined as signature residues. (B) The SDPs with the highest scores are mapped onto the three-dimensional structure of the human mNAD-ME complex with the L-malate analog (oxalate, in magenta), NAD+ (in magenta), Mn+2 (in orange), and fumarate (not shown; 1GZ3, Yang et al., 2002). Signature residues are shown as stick yellow lines. Residues involved in L-malate binding and catalysis are shown as stick red lines. Residues contacting signature residues are shown as fine lines. Domains A, B, and C are shown in different colors. For clarity, whole Domain D and the αB3-helix of Domain B were omitted in the model.