
Figure 6.
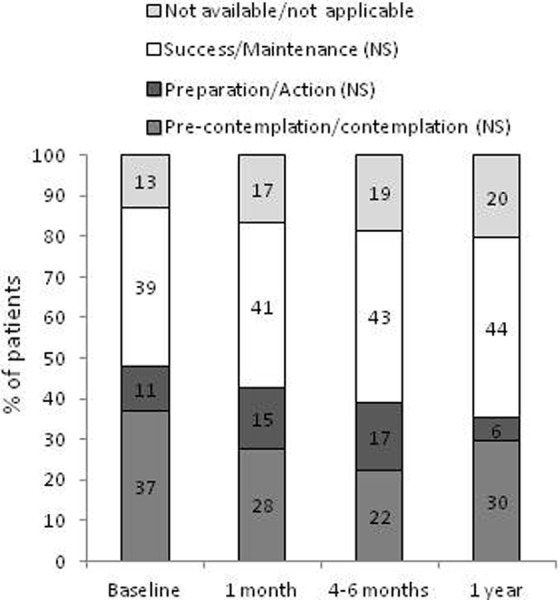
Smoking state of change. The distribution of patients belonging to different smoking state of change categories at each visit is shown in the different boxes within each bar (from bottom to top: pre-contemplation/contemplation; preparation/action; success/maintenance and not available/not applicable). Data for each smoking state of change category throughout the study were analyzed with Poisson regression models. NS: nonsignificant.