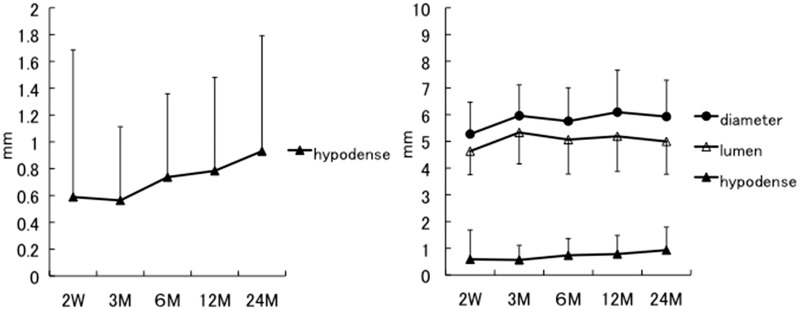
Figure 1.
These graphs demonstrate the sequential change in 36 carotid arteries using three-dimensional computed tomography angiography following carotid artery stenting. The left graph shows the sequential change of only the in-stent hypodense areas. The right graph shows the sequential change of the diameter of the stent (shaded circles), the perfusion lumen (unshaded triangles) and the thickness of the in-stent hypodense areas (shaded triangles), on the same scale.

