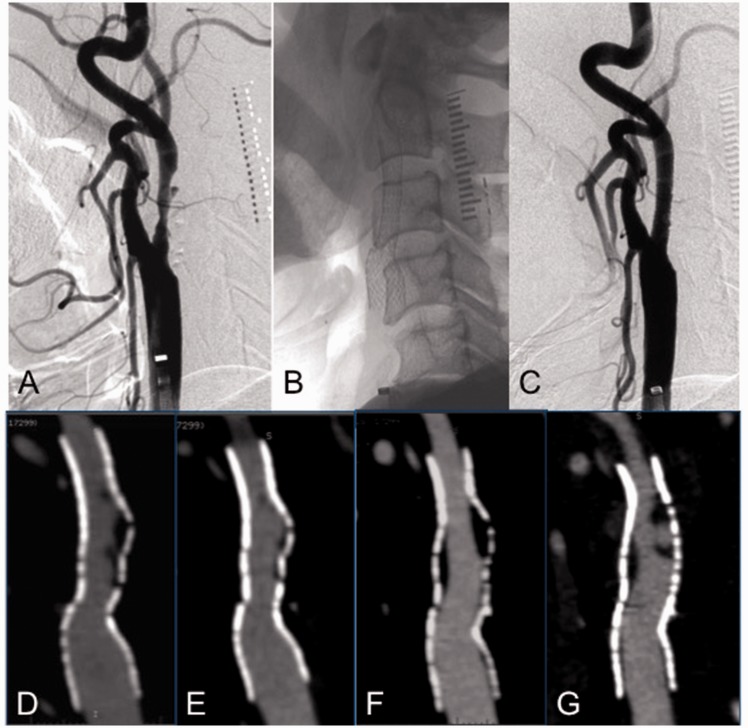
Figure 2.
A case of symptomatic left internal carotid artery stenosis (60%) with ulcer formation is shown. Upper images show lateral views of the digital subtraction angiography of left cervical carotid bifurcation. (a) Photo before carotid artery stenting. (b) Native image just after deployment of the stent. (c) Photo just after stenting. Lower images show the sequential change by parasagittal images of three-dimensional computed tomography angiography. (d) Parasagittal image at two weeks after stenting; the in-stent hypodense area is recognized between the stent and the perfusion lumen. (e) Parasagittal image at three months after stenting; the in-stent hypodense area is remarkably decreased. (f) Parasagittal image at 12 months after stenting; the in-stent hypodense area is increased again between the stent and the perfusion lumen. (g) Parasagittal image at 24 months after stenting; the in-stent hypodense area with ulcer formation is increasing again.

