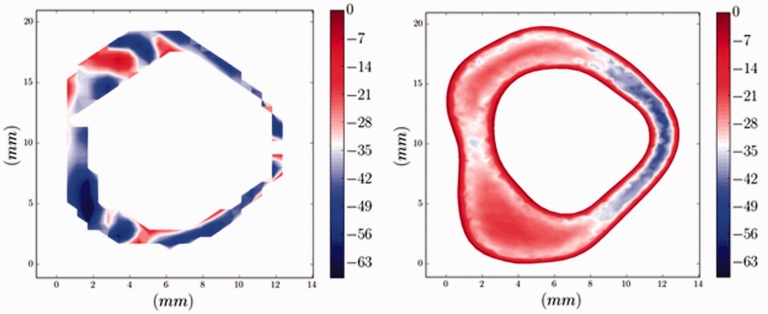
Figure 1.
Axial PC-MR image (left) and CFD image (right) during peak systolic flow in one volunteer. In both images, the anterior subarachnoid space is oriented to the reader’s left. The PC-MR image has a more pixelated appearance because of the finite pixel size and lack of smoothing. This MR image shows no zero-flow layer at the perimeter of the ROI. The CFD image shows a zero-flow layer adjacent to the dural sac and spinal cord. PC-MR shows inhomogeneity in the velocities anterolateral to the spinal cord, where nerve roots are located, and variations in velocity from 0.7 to 6.3 cm/s. CFD shows a more homogenous flow pattern with velocities in the range of 2.1 to 2.5 cm/s in the same anterolateral location. Posterior to the spinal cord, PC-MR shows some localized variation in velocities while CFD does not. PC: phase-contrast; MR: magnetic resonance; CFD: computational fluid dynamics; ROI: region of interest.

