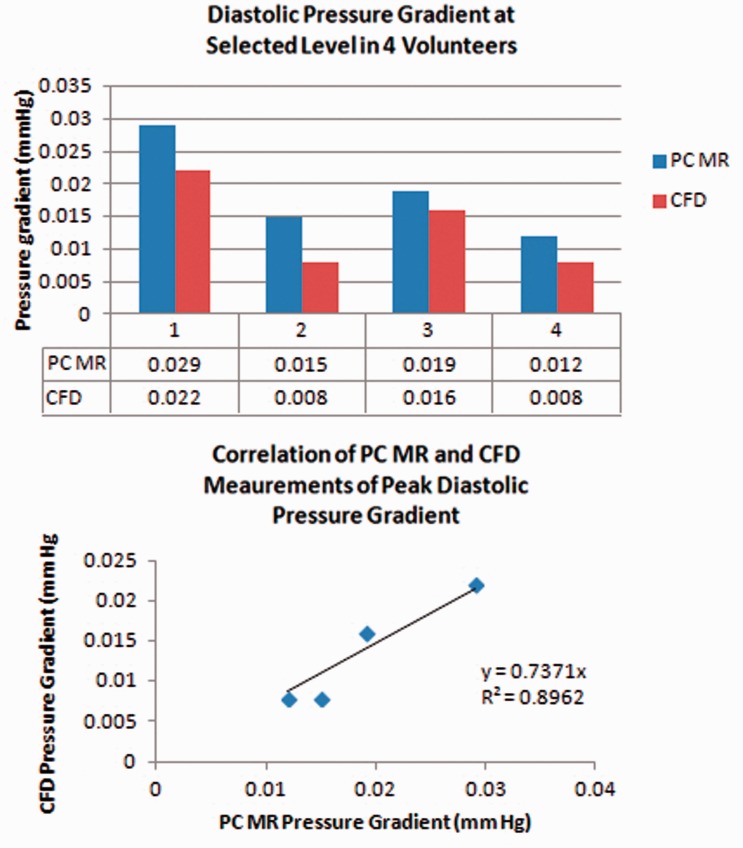
Figure 5.
Bar graph (upper) for the peak pressure gradients during diastole calculated from PC-MR and CFD for each volunteer. The PC-MR consistently produces greater values than CFD in each volunteer. Scatter plot (lower) shows the roughly linear correlation of pressure gradient measurements with CFD and PC-MR in participants. The coefficient of determination is 0.7 and the goodness of fit is 0.9. PC: phase-contrast; MR: magnetic resonance; CFD: computational fluid dynamics.

