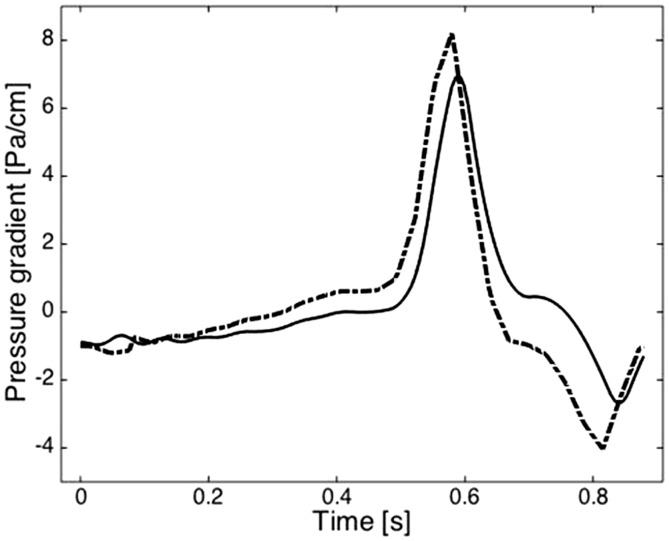
Figure 6.
Plot of the pressure gradients calculated with PC-MR (dotted line) and CFD (solid line) during the cardiac cycle averaged for the four volunteers. The slight difference in phase results from the use of the velocity in successive phases in PC-MR to calculate pressure for each point in the cardiac cycle versus the use of millisecond temporal resolution in CFD. PC: phase-contrast; MR: magnetic resonance; CFD: computational fluid dynamics.

