
Figure 3.
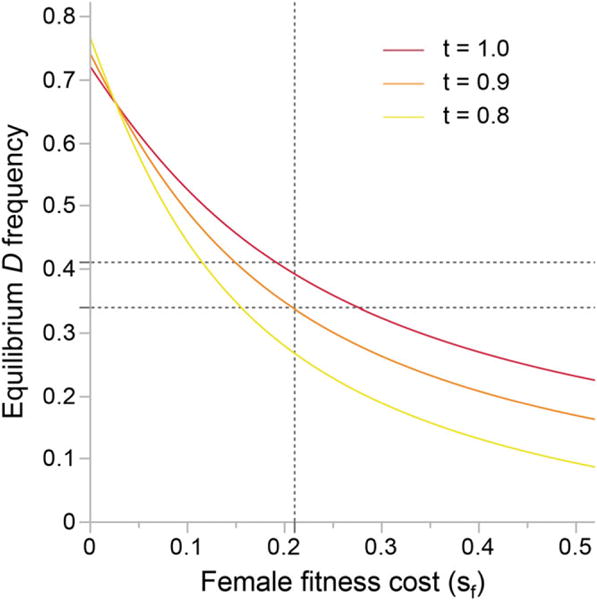
Equilibrium frequency of D is predicted as a function of the recessive female fitness cost for three outcrossing rates. Previous estimates for the strength of drive and the male fitness cost were assumed (sM = 0.20, δ = 0.58, hM = hF = 0; Fishman and Saunders 2008). The vertical line indicates the mean female cost across our four-year study period and the horizontal lines bracket field estimates of D frequency.